Fortunes Algorithm for Voronoi diagrams. Part 1. Where reader receives a lot of homework
In April 2019 I didn’t know about a term generative art. I wanted to use Math and programming skills implement something visually pleasing. Metaballs seemed a good idea to start with. I collected some information and stumbled upon nice article of Jamie Wong “Metaballs and Marching Squares”. He mentioned “Voronoish” style example. I recalled Voronoi diagrams and… here we are.
I don’t know if it’s a good idea to implement classic algorithms from scratch. I enjoy it as it is a good chance to become better developer. Also don’t be mistaken that implementing FortunesAlgorithm is just a matter of typing what’s said in the book. Believe me, platform restrictions and cruel edge cases wont let you relax.
The goal
To understand this article you should be familiar with Euclid geometry. Computer Science background and some proficiency in Swift language are also required.
The goal of this article is to provide reader with a set of resources for future understanding of Voronoi diagrams on the intuitive level.
Definition
Voronoi diagram is a diagram that assigns a set of predefined points in a plane into an equal number of cells, such that each point ${p}$ is inside a cell consisting of all regions closer to ${p}$ than to any other point.
Intuition
Assume You own N data transmitters. Each of your customers can connect to one and only one transmitter (the closest one). Knowing geographic coordinates of each transmitter, how to count approximate number of customers?
Let’s rephrase it a bit.
Suppose we have some magnets and metal balls placed on the table. Each magnet has the same attraction force. Magnet attracts a metal ball closest to it. Or ball will be assigned to the nearest magnet. As it illustrated on fig 1, magnet A will attract all the metal balls placed in the cell colored blue, B - red and so on.
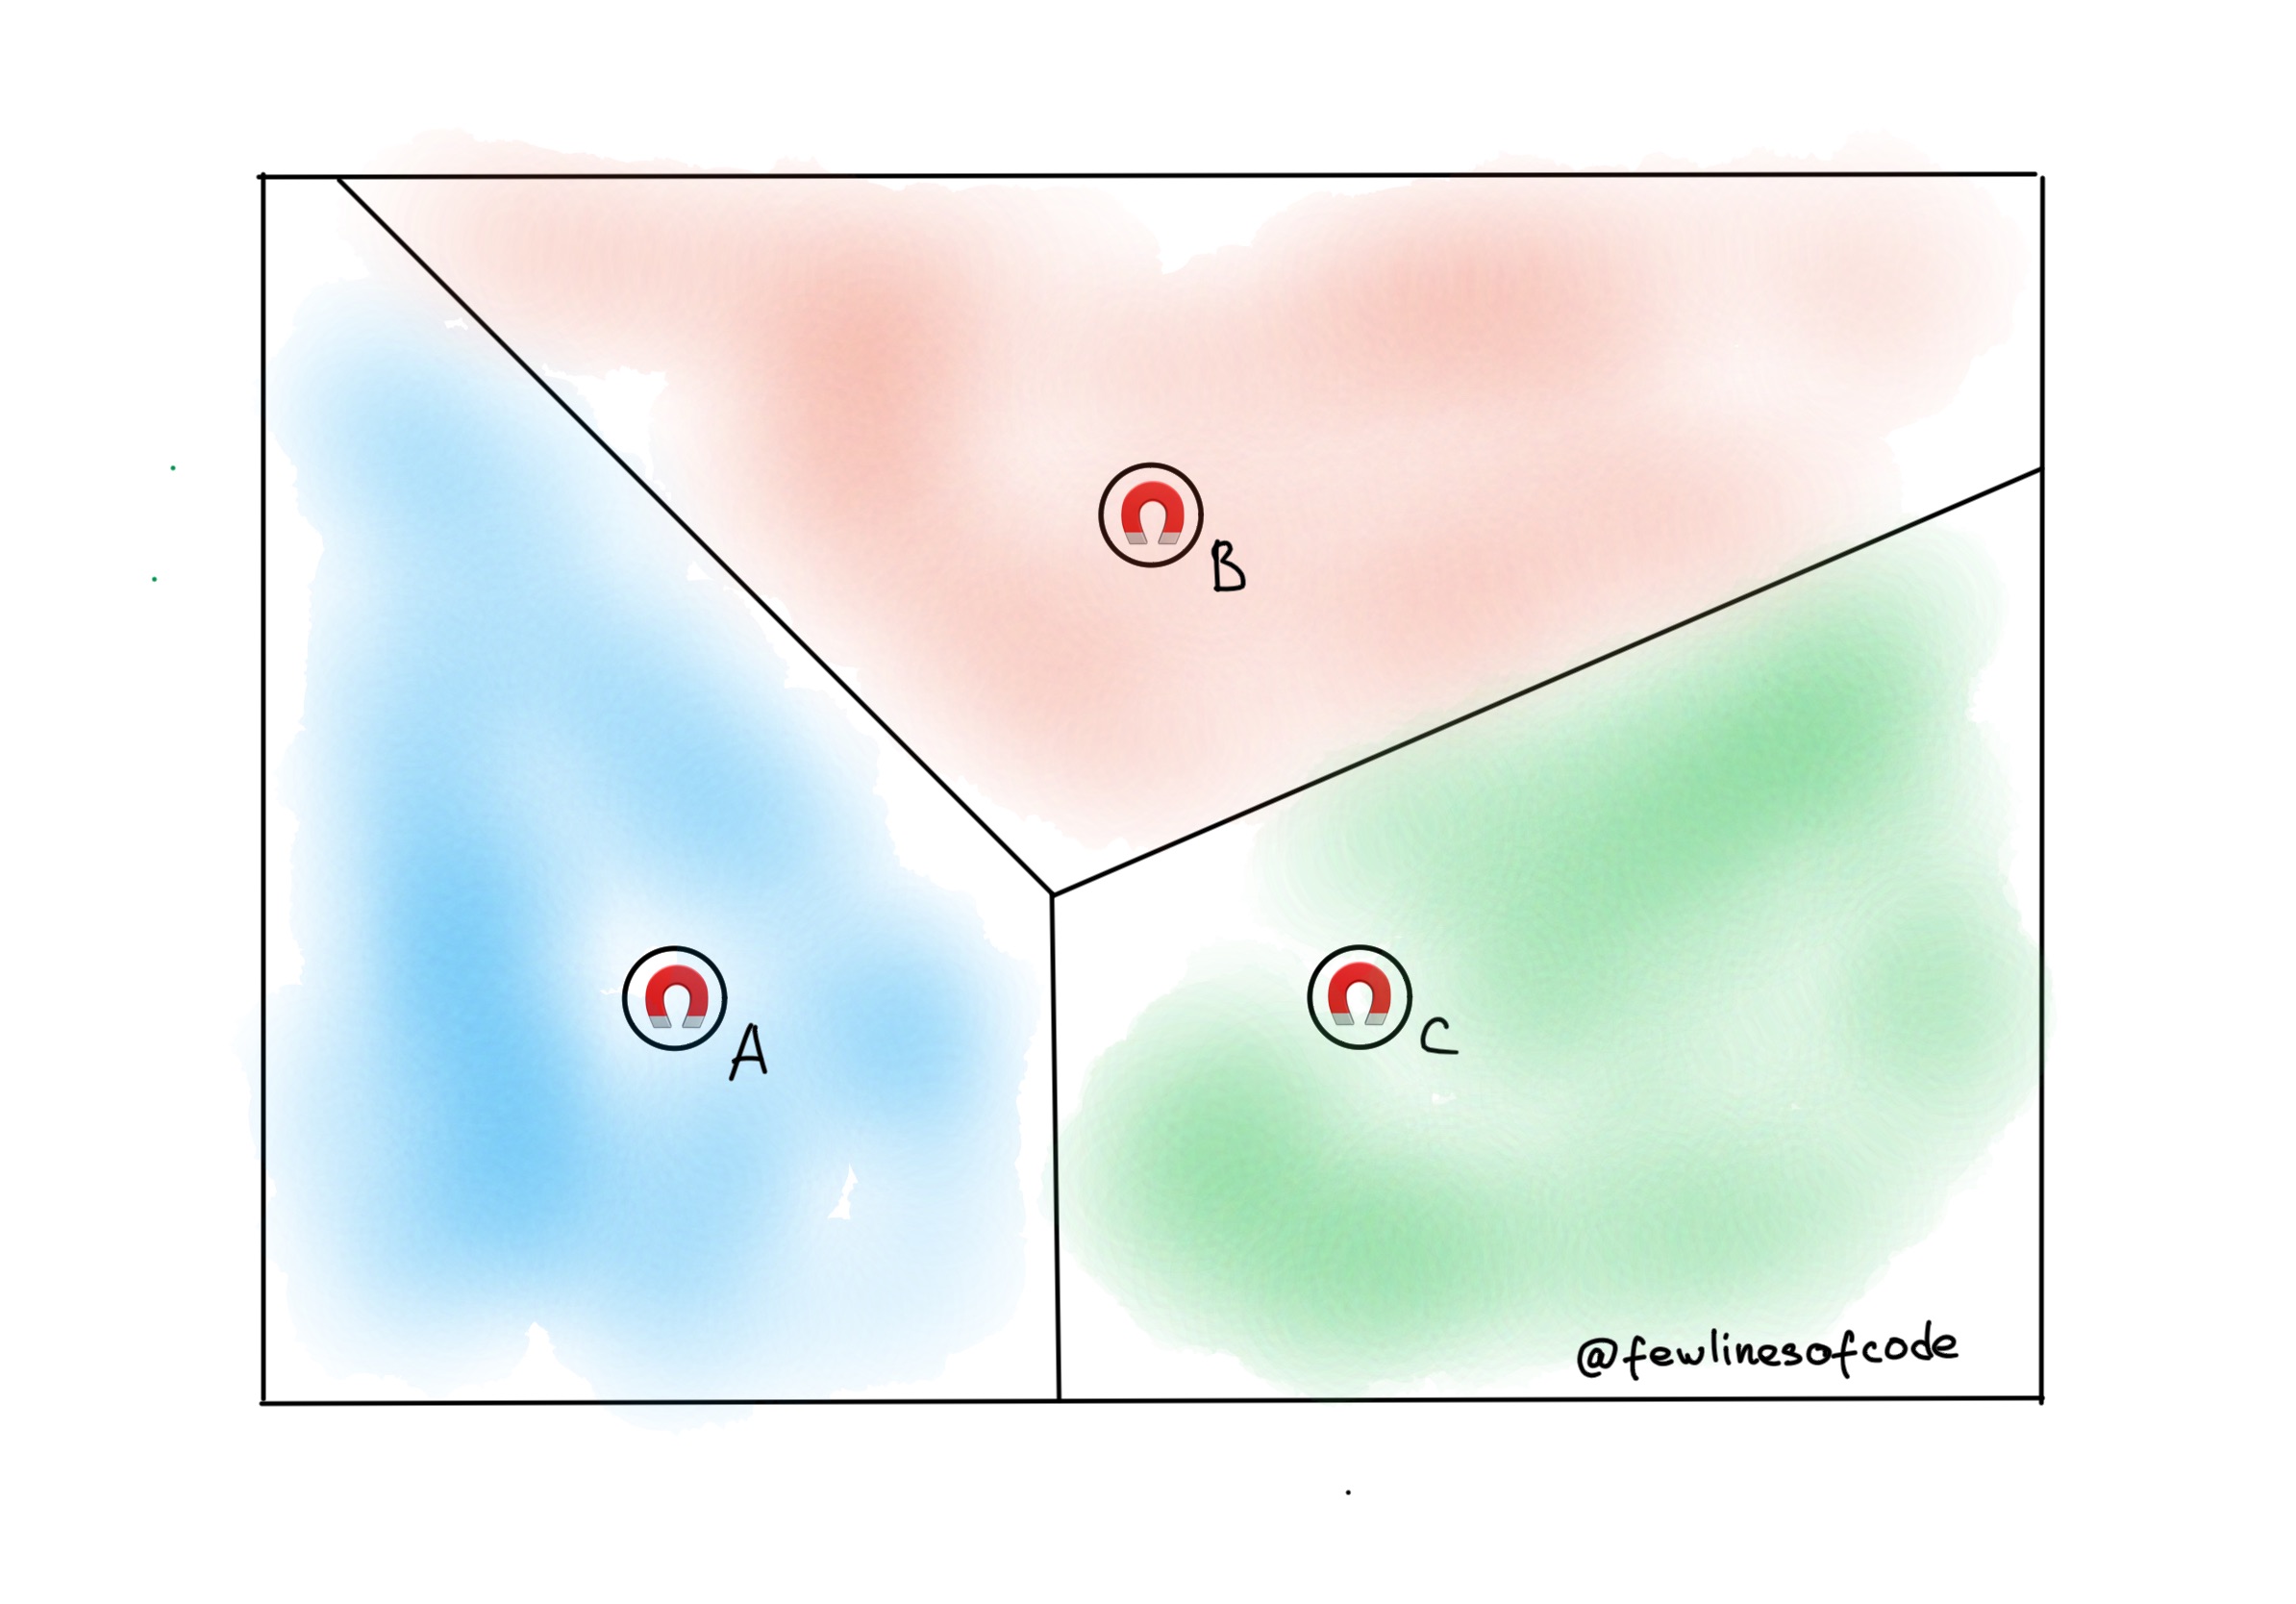
In computational geometry magnets are called Sites. Geometric interpretation of the model where point is assigned to the nearest site is called Voronoi assignment model. If we contour the regions of attraction for each magnet, we will receive planar subdivision called Voronoi diagram of the set of sites.
Voronoi diagrams are fundamental data structures that have been extensively studied in Computational Geometry. Range of Voronoi diagrams is very wide. They are used in physics, astronomy, robotics, spatial analysis, social geography, computer graphics and many more. There are many of Voronoi diagrams1.
This article is an introductory article in a series that will guide you through the process of building Voronoi diagram using Fortunes Algorithm2.
Fortunes algorithm
Fortune’s algorithm is a sweep line algorithm for generating a Voronoi diagram from a set of points in a plane using O(n log n) time and O(n) space. It was originally published by Steven Fortune in 1986 in his paper “A sweepline algorithm for Voronoi diagrams.”
Home work
Here is a list of definitions required to understand the implementation:
- Input
- Site
Processing - Circle event - Site event - Sweep line - Beach line
- Output
- DCEL
- Cell
- Half-edge
- Vertex
- Site
- DCEL
The list is based on understanding of the following Geometry and Computer Science concepts:
Geometry:
- Point 2d
- Lines in the plane
- Line segment
- Euclidean plane
- Planar Tessellation
- Parabola
- Convex hull
- Rectangle
- Circle
- Very basic linear algebra
- Determinant
Computer Science:
If you are not familiar with some of them - don’t worry. You will be provided with brief explanation and resources for further reading. Also you can always come back to this list at any time and refresh your memories.
Hope you will be interested in Part 2 Where reader will be provided with an easy to grasp explanation of DCEL data structure.
Sincerely yours, @fewlinesofcode!